 Strategy Explorer
Understand the strategy before you switch it on.
Compare how each automated crypto strategy enters, scales, exits, and manages risk across market volatility. The goal is simple: no black box before your capital is connected.
- Execution logic
- Risk controls
- Asset-specific bots
Execution Map
Transparent
Strategy Explorer
Discover your favorite automated trading bots by either selecting your favorite exchange or selecting the assets you would like to trade and profit from.
Scroll to the bottom to see the results.

Getting Started
Once you have selected your desired strategy, the automated trading system starts after your funds are deposited in your selected exchange account, and your trading API keys have been submitted to us via the activate bot action. The system then connects your account and begins executing trades based on our volatility-harnessing strategy, capitalizing on day-to-day asset price fluctuations.

Automated Execution Process
Fund Deposit
Deposit funds into your selected exchange account to begin automated trading
API Connection
Submit trading API keys via the activate bot action for secure account connection
Strategy Execution
System begins executing trades with precision
Human Monitoring
24-Hour expert human oversight of all users trades for continuous safety
How Does the Strategy Execute?
The strategy is based on the easy to understand DCA (Dollar Cost Averaging) concept, meaning we let the market come to us. With meticulously placed limit orders, we optimize your position's average breakeven price, positioning you to capture early rebounds and lock in profits swiftly.
This is last month's replay of the CB011S strategy.
Blue Arrows = Buy
Blue arrows mark the level where the market reached a previously placed resting limit order.
Red Arrows = Sell
Red arrows mark the level where the market reached the exit level, triggering a complete position close to book profits for that particular trade.
Orange Lines = Order Levels
Orange lines represent the levels in which the subsequent orders are placed.
Blue Line = Breakeven
Blue lines represent the position's breakeven price, which is dynamically adjusting as resting orders get filled.
Green Line = Target Price
Green lines represent the target price level which is dynamically adjusting as resting orders get filled.
Trade Execution Process
Our trade execution process follows a systematic approach with four key phases: Initial Order Placement, Subsequent Order Placement, Market Execution, and Rebound Sales.
1. Initial Order Placement
Foundational order based on a fraction of your portfolio establishes your position and sets the stage for the systematic DCA execution.

2. Subsequent Order Placement
The system places subsequent orders based on indicator readings and our smart scaling system that dynamically adjusts order sizes for optimal positioning while maintaining risk management.

3. Market Execution
Wait for the market to fill our DCA orders, or reach our dynamic Target Profit price while having expert monitoring around the clock.

4. Rebound Sales
Profits are realized as the trend changes direction, using our dynamic target profit levels for optimal exits and trade frequency.
.svg)
DCA Strategy
DCA is only part of the story. The real magic lies in:
- Strategic order placement
- Choosing the right direction
- Optimizing your full balance to navigate heightened volatility
- Balancing risk and reward
Dive into the sections below to discover how it all works.
LOSDCA Strategy: Limit Order Scaling Dollar Cost Averaging
LOSDCA systematically purchases assets using a scaling rate applied to order sizes. This approach aims to average the purchase price as closely as possible to the current market price, utilizing limit orders to manage entry points and mitigate sudden price fluctuations.
↗Long Strategy Example
Example of a long strategy using LOSDCA with multiple buy entries, an average price calculation and a rebound sale at the volume's node point of control.

↘Short Strategy Example
Example of a short strategy using LOSDCA with multiple sell entries, an average price calculation and a rebound sale at the volume's node point of control.

.svg)

Position Direction & Market Top/Bottom Indicators

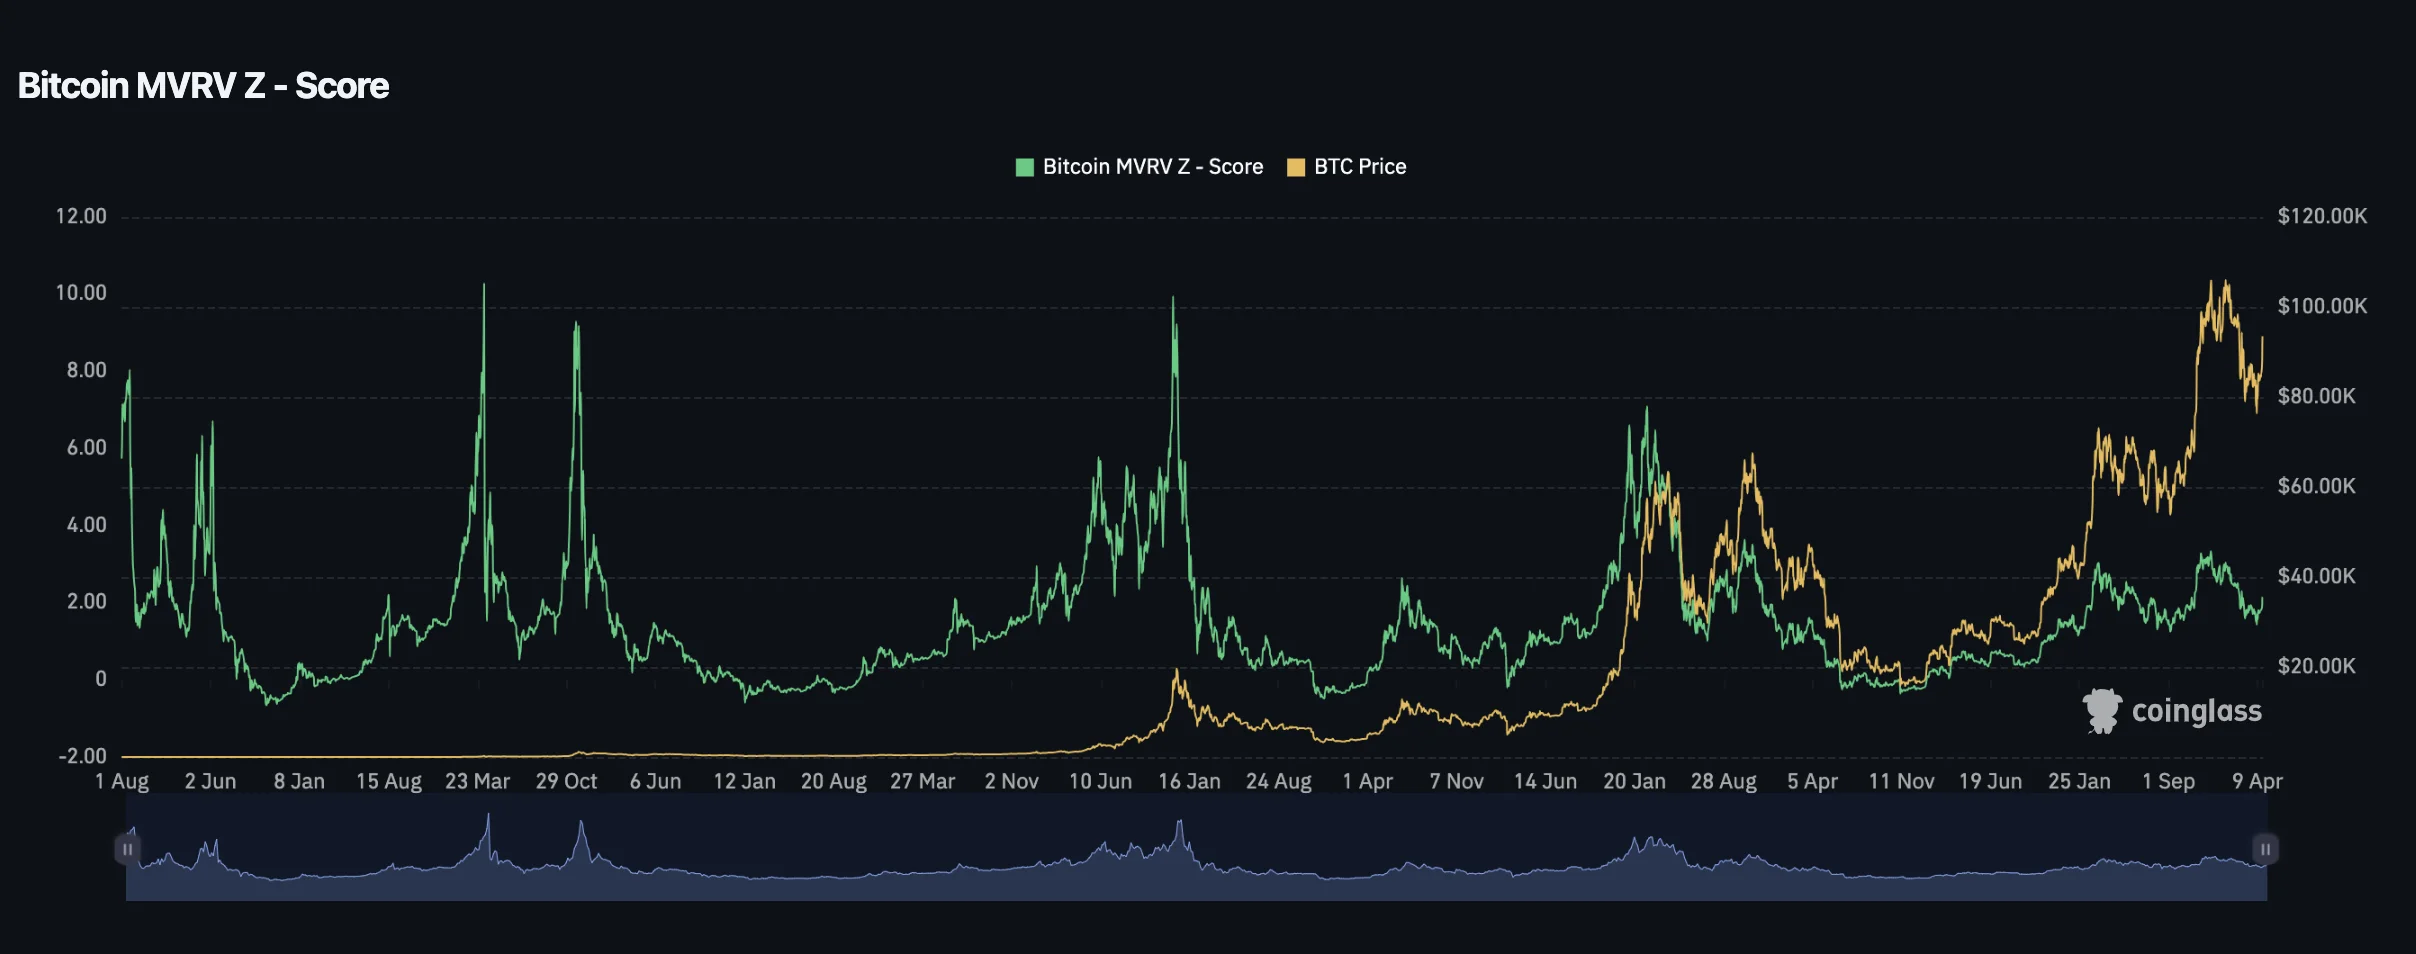
Bitcoin strategies rely on the Pi Cycle Top and Bottom indicators, the Puell Multiple, and the MVRV Z-Score together as primary indicators to confidently determine the next trade's direction.
Pi Cycle Top Indicator
Uses 111-day EMA vs. 350-day EMA × 2 to signal potential market tops. When the 111-day EMA crosses above the 350-day EMA (times 2), it signals a potential market top.
In this example, you can see how a bot is continuously positioned long, right until the "Pi cycle" top indicator flashes.

Right after the top is confirmed, the system then switches the positions direction to follow the new confirmed market trend.

Pi Cycle Bottom Indicator
Uses 150-day EMA vs. 471-day SMA to signal potential market bottoms. When the 150-day EMA crosses above the 471-day SMA, it signals a potential market bottom.
In this example, you can see how a bot is continuously positioned short, right until the "Pi cycle" bottom indicator flashes.

Right after the bottom is confirmed, the system then switches the positions direction to follow the new confirmed market trend.

 2/3 Indicators for confirmation
Our system confirms a trend reversal when any two of the three top/bottom indicators show a top signal.
MVRV Z-Score
On-chain metric comparing market cap to realized cap. Tops occur at Z-scores >7-8, bottoms at Z-scores <0-1. This indicator has a strong track record for both tops and bottoms.
Puell Multiple
Measures Bitcoin miners' revenue relative to its historical average. Tops occur at multiples above 4-5, bottoms at multiples below 0.5. This indicator reflects mining economics and supply dynamics.

 Altcoin based strategies
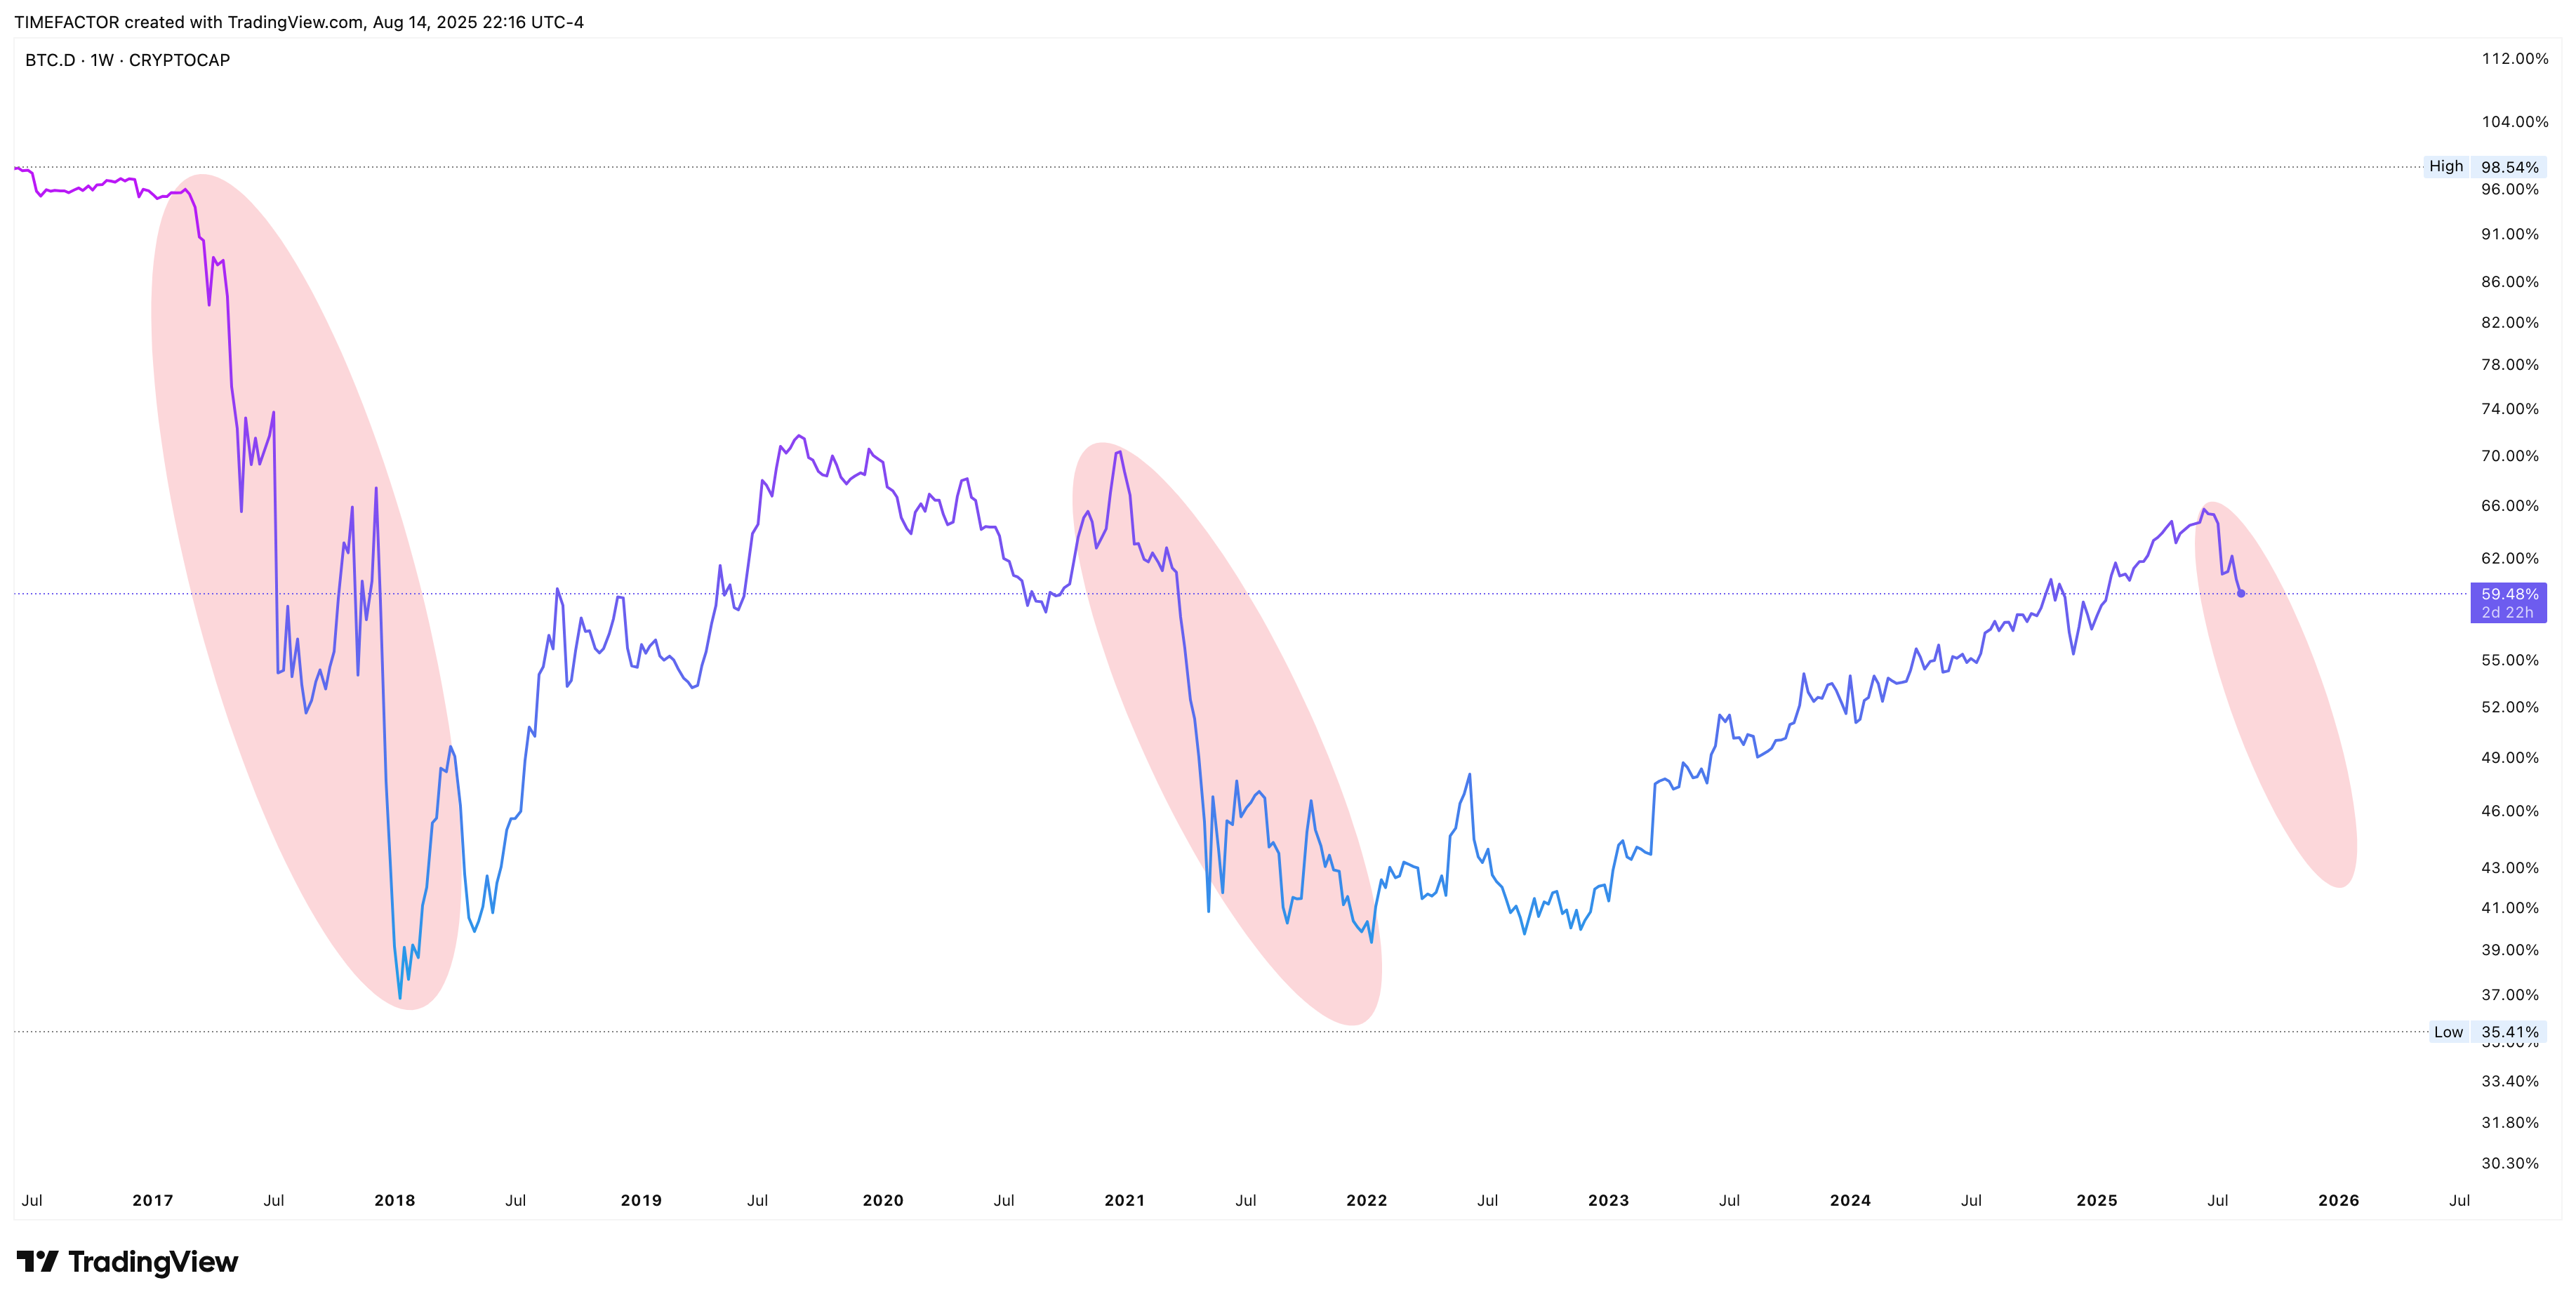
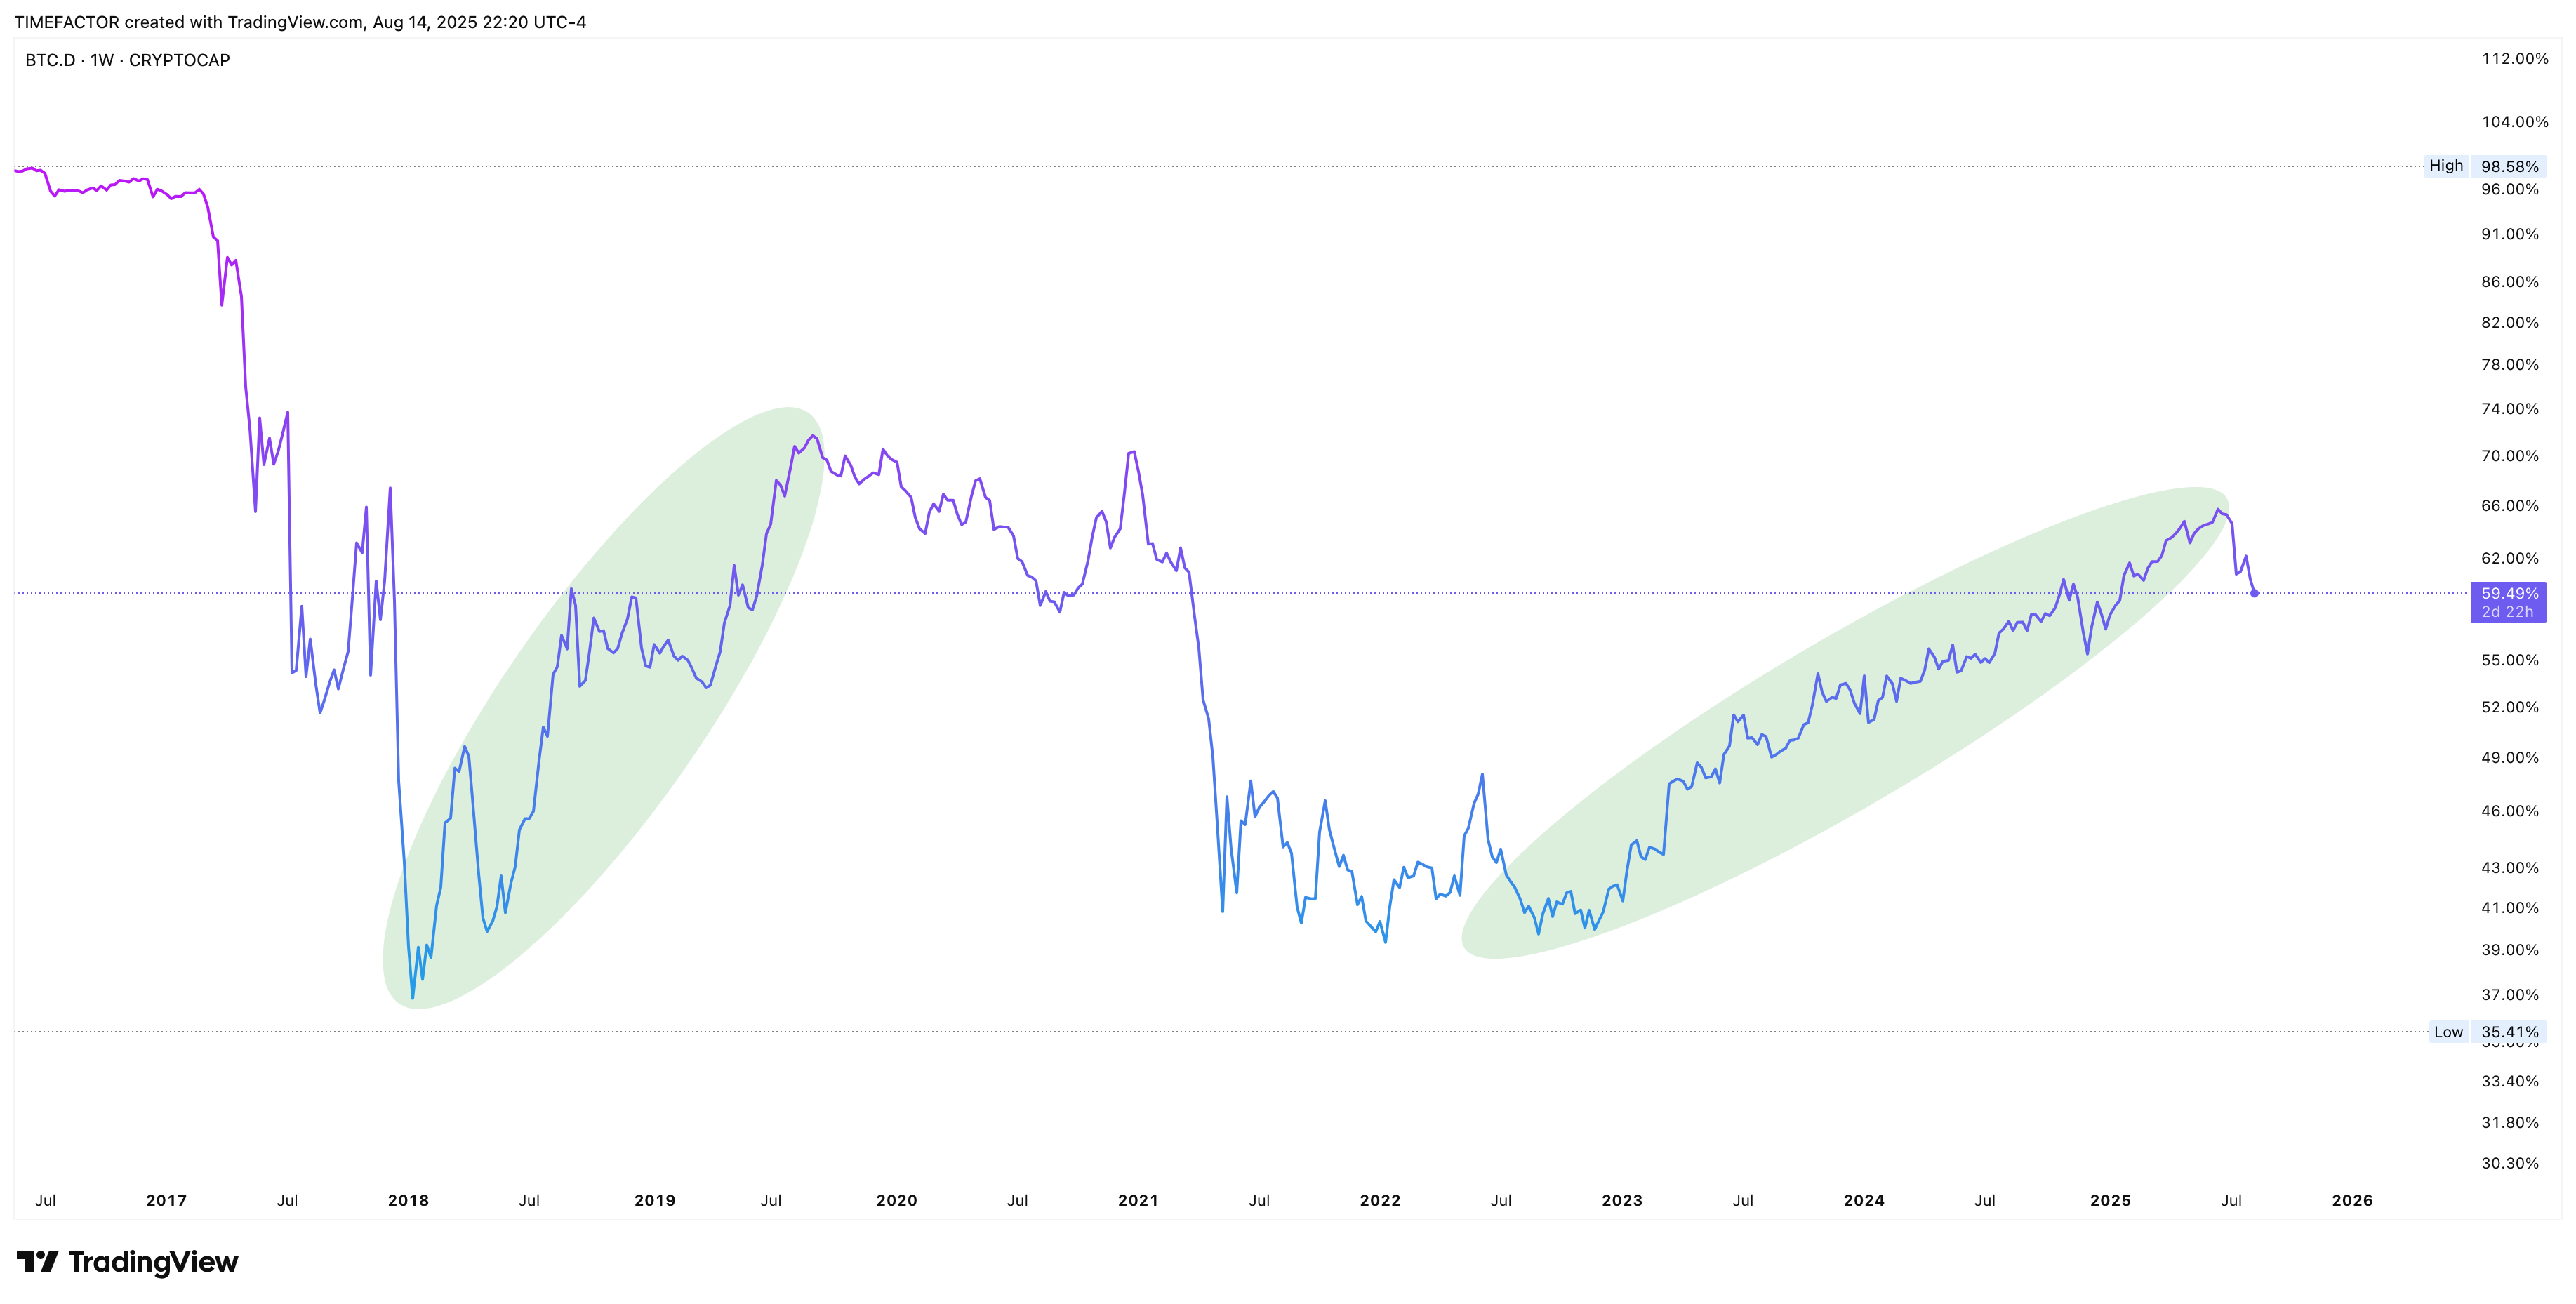
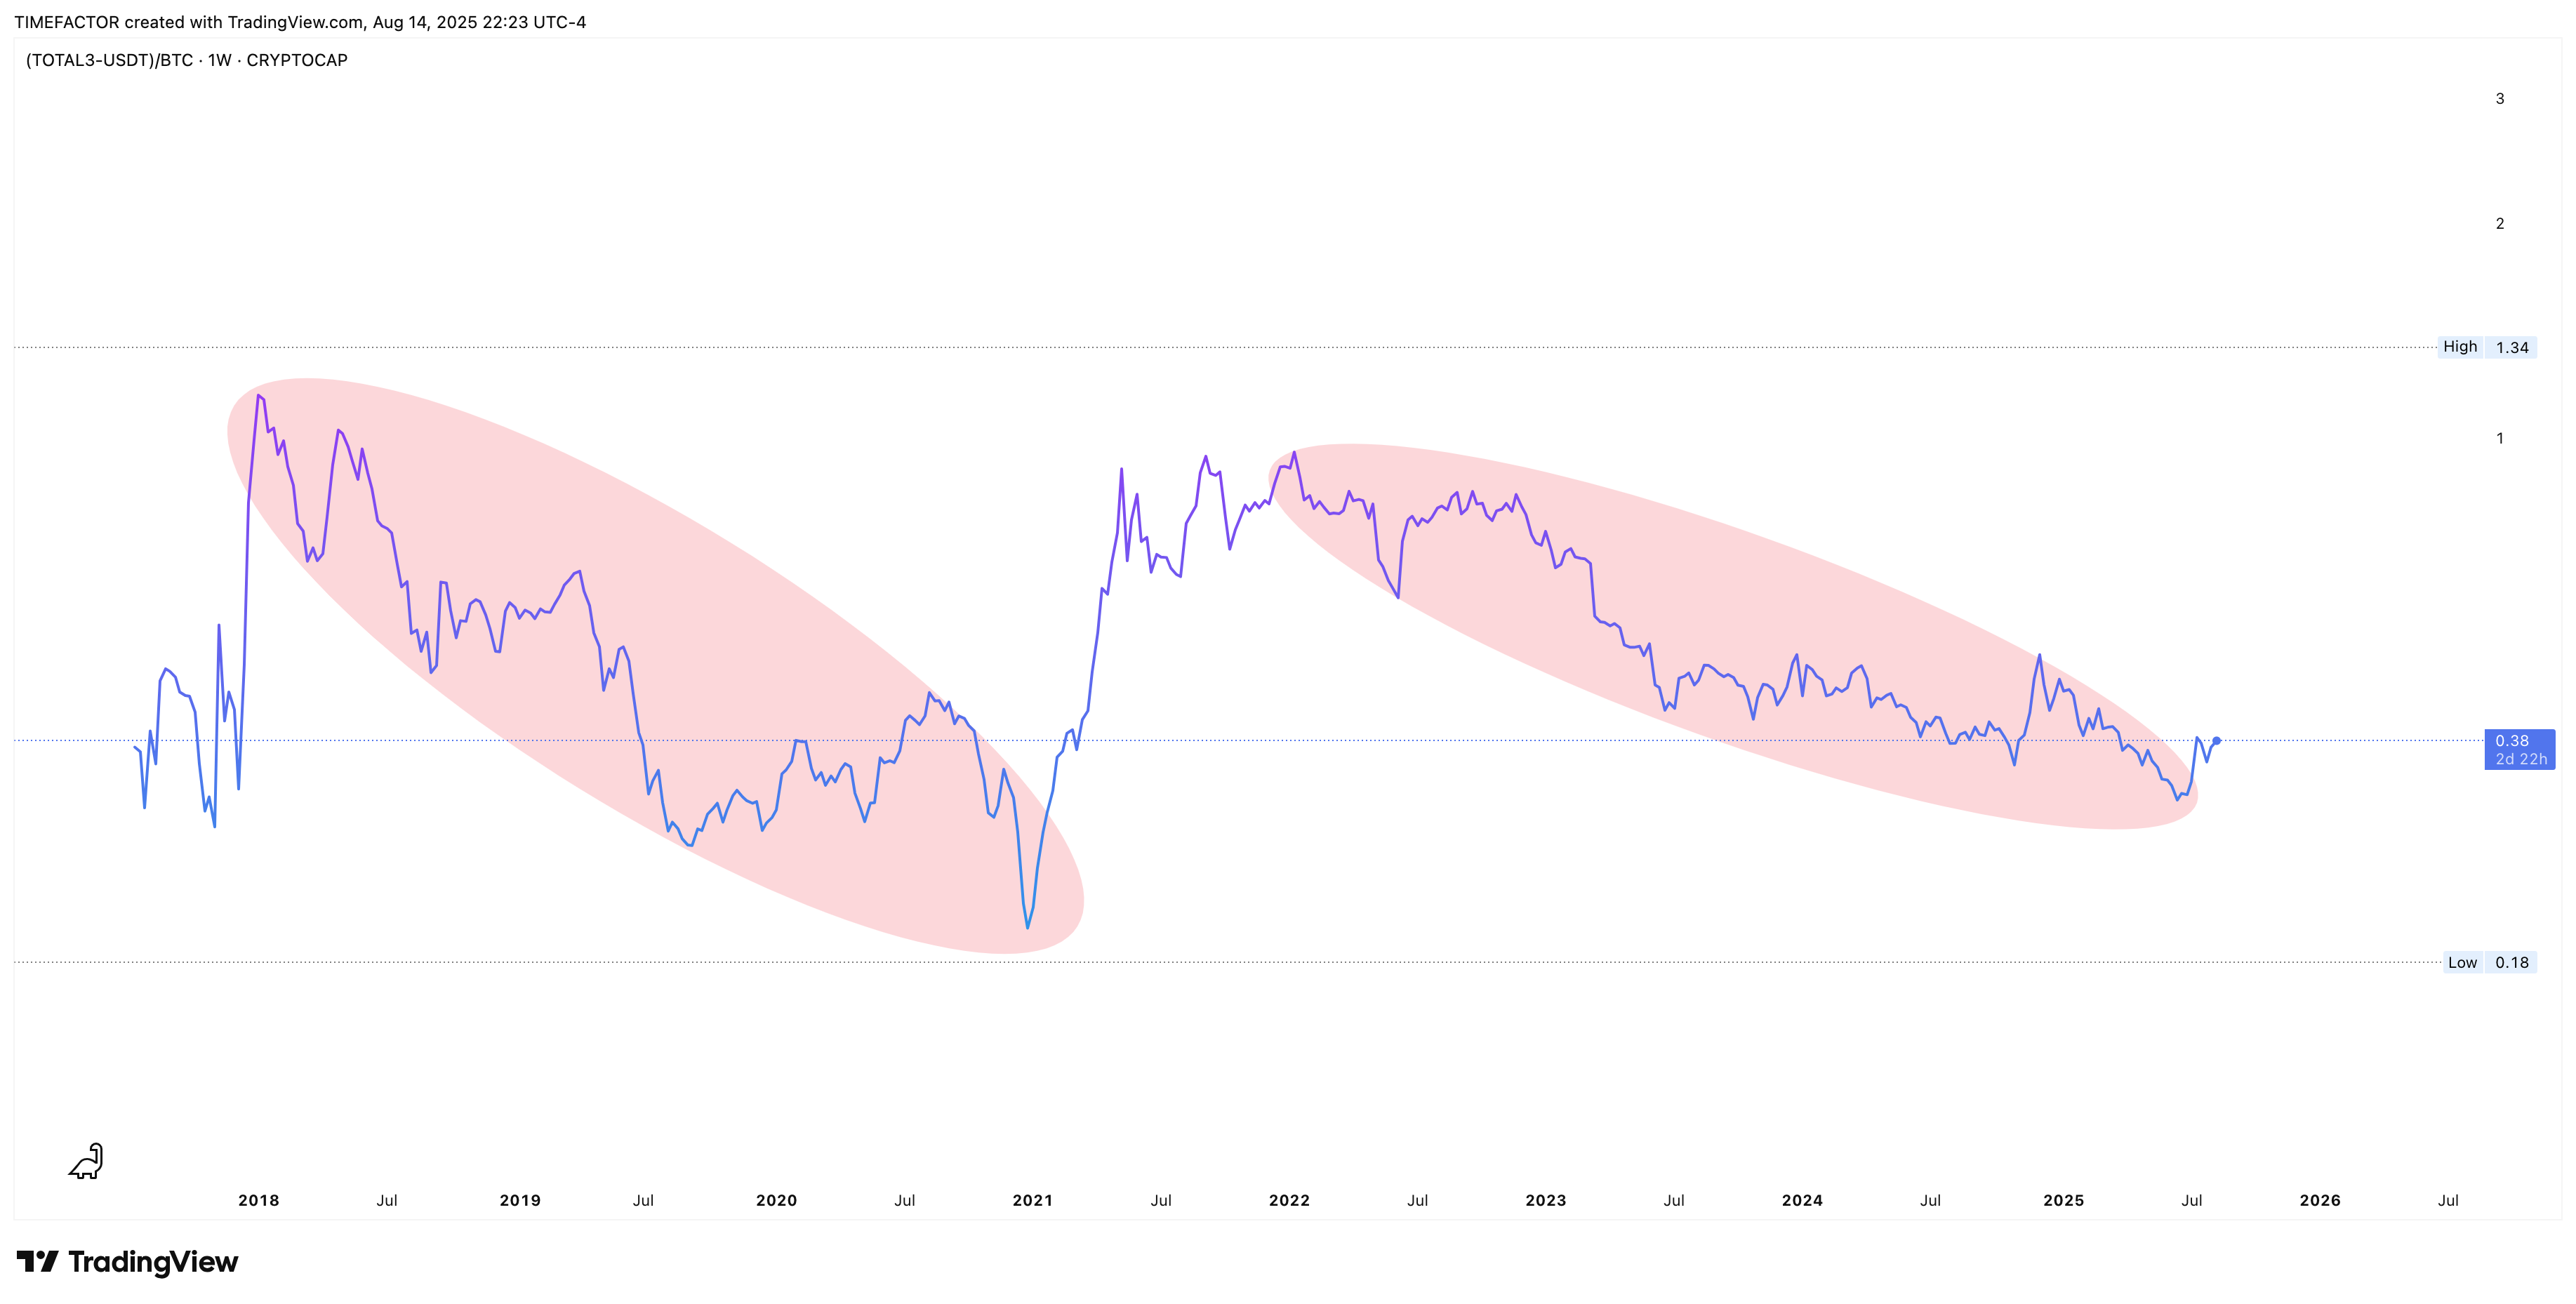
Altcoin-based strategies determine position direction based on cyclical market trends. Using the Bitcoin Dominance (BTC.D) and ALTS/BTC as primary indicators, our bots can confidently predict the direction of the next trade.
Altcoin Bull Market
Our strategies will take long positions during a defined altcoin bull market. Our system identifies this period as when Bitcoin Dominance (BTC.D) reaches its upper range, coinciding with the ALT/BTC pairing hitting its lower range.
Altcoin bull markets defined by periods marked in red where BTC.D trends down.
Altcoin bull markets defined by periods marked in red where ALT/BTC trends up.
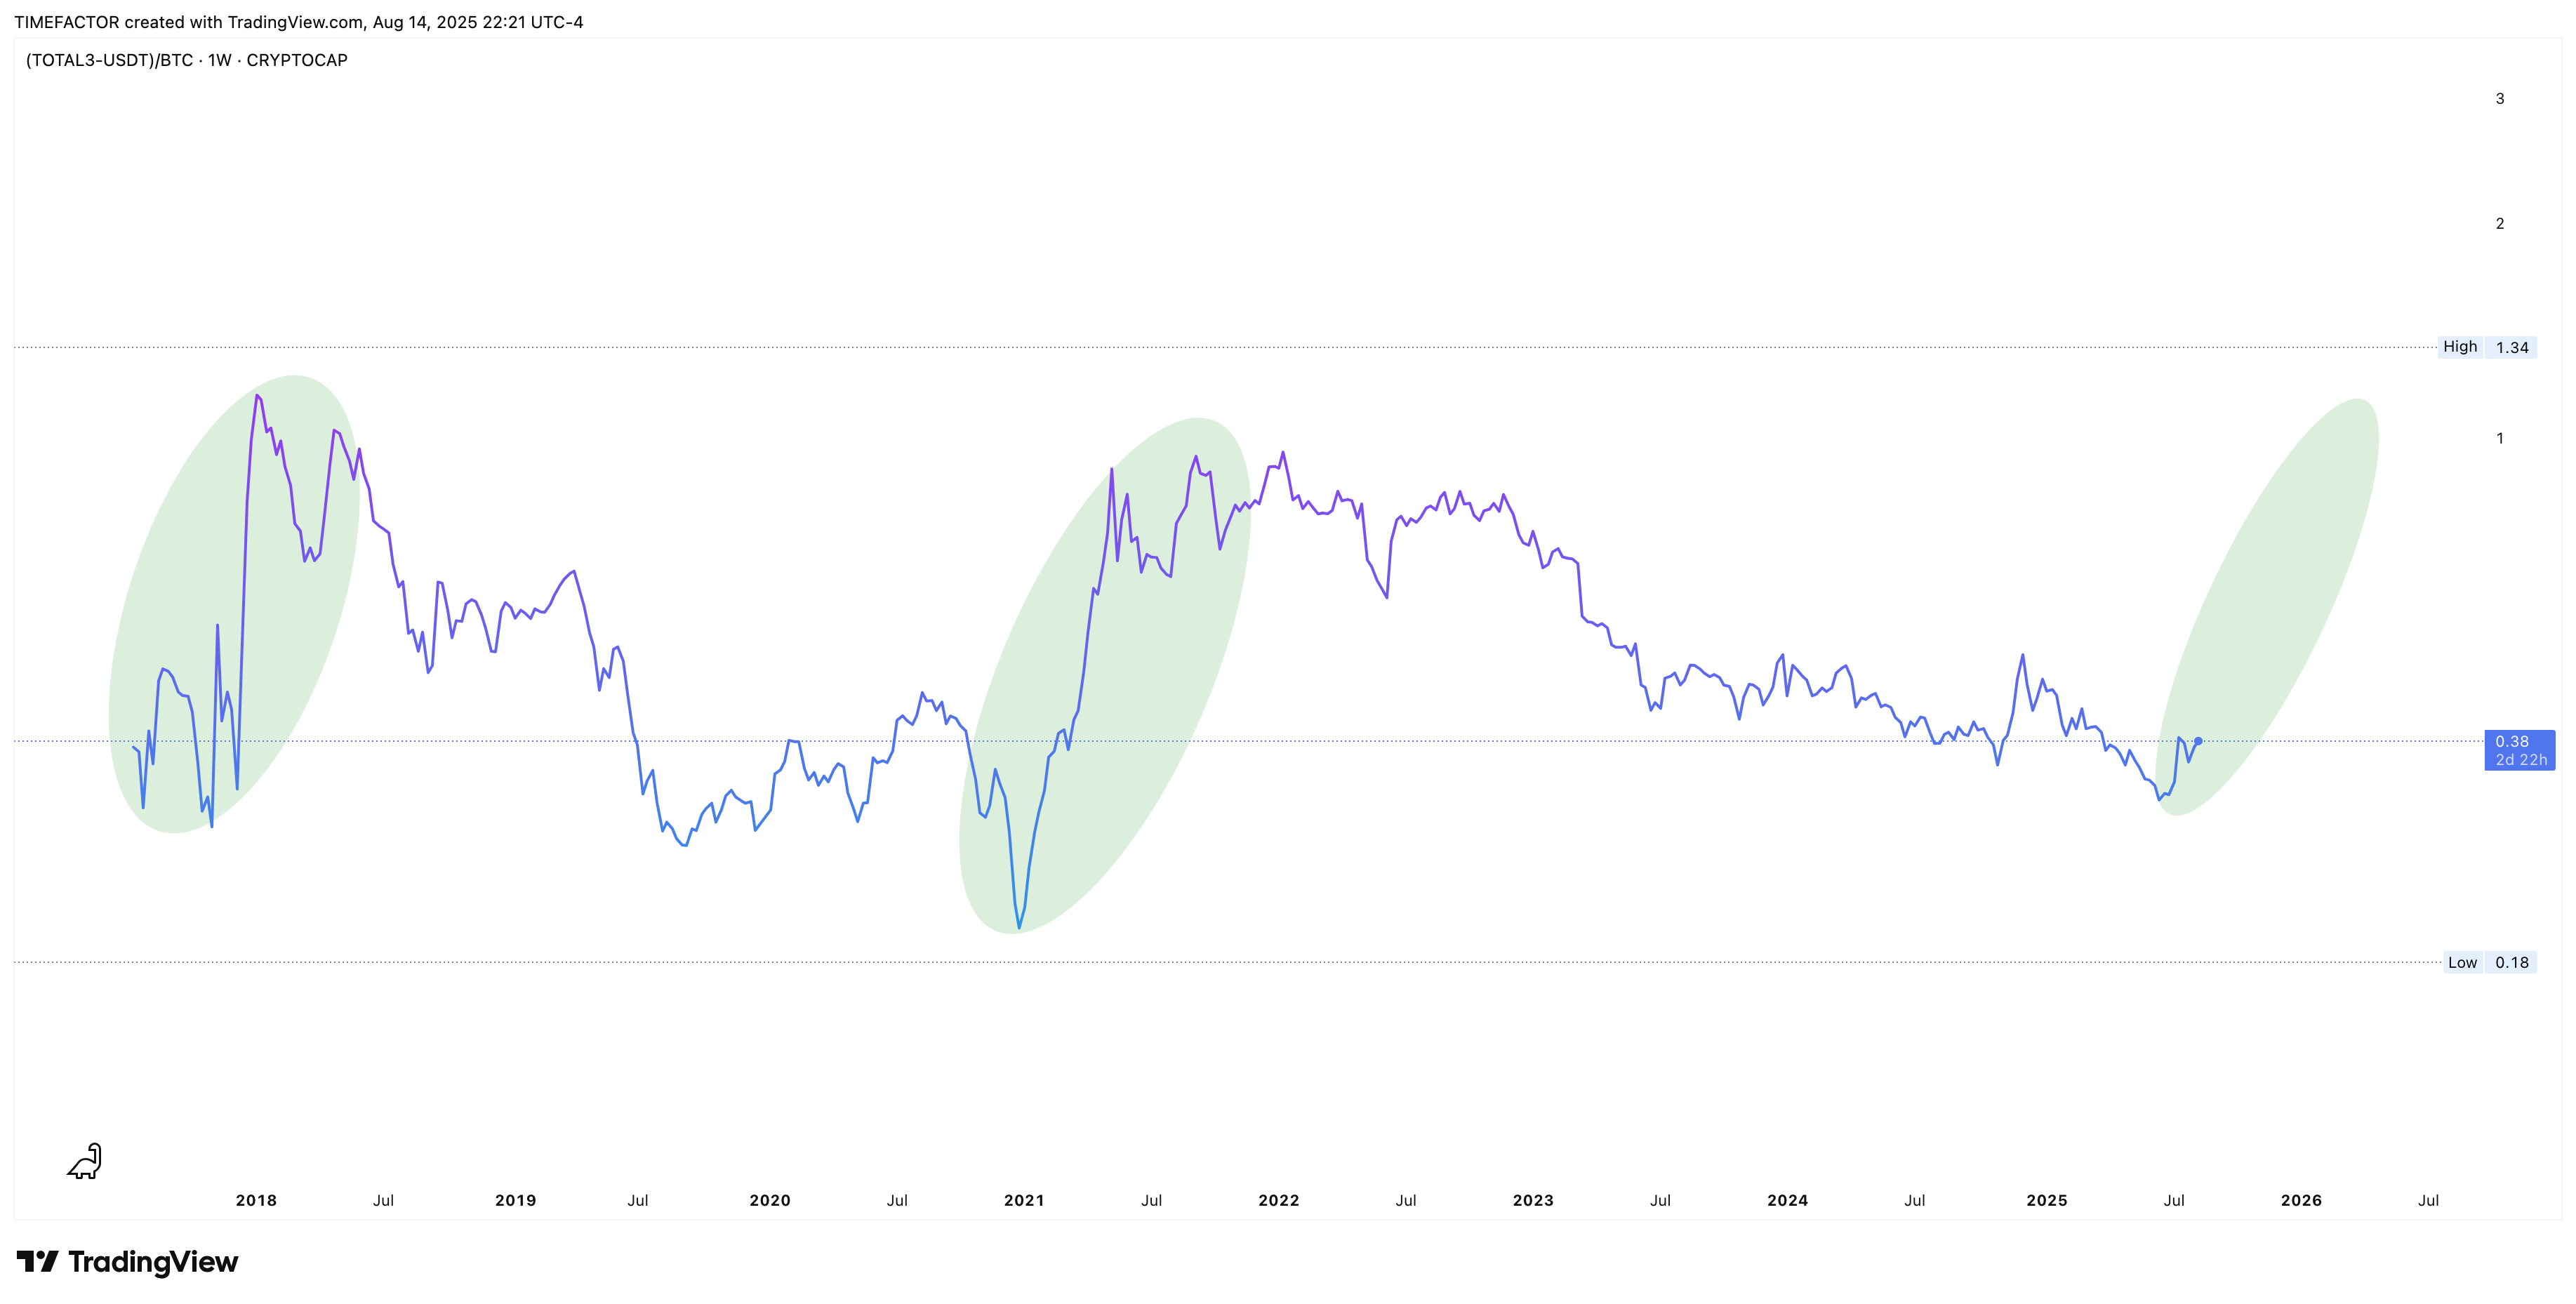
Altcoin Bear Market
Our strategies will take short positions during a defined altcoin bear market. Our system identifies this period as when Bitcoin Dominance (BTC.D) reaches its lower range, coinciding with the ALT/BTC pairing hitting its upper range.
Altcoin bear markets defined by periods marked in green where BTC.D trends up.
Altcoin bear markets defined by periods marked in red where ALT/BTC trends down.
 Strategy Adaptation
The system adapts by closing current deals and switching the strategy's position direction when the indicators signal a change in market conditions. This ensures the strategies align with broader market trends and business cycles.
Market Analysis Tools for Order Placement
Our bots use various indicators to gauge market conditions, including liquidity cluster maps, heat maps, and proprietary indicators.
These tools help determine the optimal placement of limit orders.
 Liquidation Levels Analysis
Our system analyzes liquidation levels to understand market structure and identify optimal entry and exit points. This helps us capitalize on market inefficiencies.

Liquidation levels analysis showing long and short position clusters
🔍Liquidity Cluster & Heat Maps
Advanced visualization tools that map liquidity concentrations and market sentiment across different price levels. These maps help identify areas of high trading activity and potential support/resistance zones for optimal order placement.

Heat map showing liquidity distribution and market activity patterns
 Risk Management
When it comes to risk management, our strategies emphasize balancing risk and reward by cautiously using leverage, selecting the appropriate strategy direction based on our indicator signals, and offering the flexibility to diversify investments across various assets and exchanges.

Conservative Leverage Usage
Our system uses a maximum leverage of only 1.5x out of 125x possible across all strategies, providing wide safety net before additional margin required.
Appropriate Strategy Direction
Selecting the appropriate strategy direction based on the combination of our market top and bottom indicator signals.

Investment Flexibility
Offering the flexibility to diversify investments across various assets and exchanges to minimize risk and maximize opportunities.

Human Monitoring
24-Hour expert human oversight of all users trades for continuous safety
Perfect for Crypto Newcomers & Experienced Traders
Our bots are built for everyone: from crypto beginners looking for a great first experience to yield hunters, dividend enthusiasts, profit chasers, money market experts, and advanced traders who appreciate consistency when it comes to automation.
Crypto Newcomers
Start your crypto journey with a positive first experience. Our conservative and transparent approach makes automated crypto trading accessible to everyone.
Yield Chasers
Maximize your crypto holdings with automated yield generation. Our bots target 2.0%+ to 4.0%+ monthly returns with conservative risk management.

Sophisticated Traders
Algorithmic trading with consistency. Perfect for traders who appreciate a systematic approach.
Trusted by Strategy-Driven Traders
Discover how our systematic strategy, conservative leverage use, and proven market indicators help traders navigate crypto markets with confidence and precision.
David K.
LOSDCA Strategy Trader
"The LOSDCA strategy's systematic scaling with limit orders is game-changing. It can strategically average down during market dips and maximize gains during uptrends. The 40% safety net gives me confidence to let it execute autonomously with precision."
Isabella M.
Multi-Asset Portfolio Manager
"The multi-asset diversification approach is incredible. I can spread my investments across Bitcoin, Ethereum, Solana, and stablecoins through multiple exchanges. This has significantly reduced my portfolio risk while maximizing opportunities across different market conditions."
Robert J.
Risk Management Expert
"The 1.5x max leverage with 40% safety net is perfect for my risk tolerance. The Pi Cycle, MVRV Z-Score, and Puell Multiple indicators work in harmony to guide market timing decisions."
Trust & Verification
You've seen our strategies, now see why traders around the world
trust us with their investments.
SSL Secured
Bank-level encryption for all data transmission
Transparent Data
Full disclosure of all performance metrics
Regulatory Compliance
Adherence to CFTC/NFA guidelines
Proof of Performance
Blockchain-verified trading results
Derivatives Understanding & Advanced Concepts
Understanding Inverse Perpetual Contracts/Swaps and Linear Contracts
Inverse perpetual contracts/swaps and linear contracts are types of derivatives used in crypto trading. They differ in how you hold assets and how profits are denominated.
Inverse Perpetual Contracts/Swaps:
We design these for holding and trading cryptocurrencies like Bitcoin. Your investment (collateral) and profits are both measured in the cryptocurrency itself (e.g., you deposit and earn in Bitcoin).
Linear Contracts:
These are for earning profits in USD or stablecoins (like USDT). You may still hold crypto, but your profits are denominated in USD terms.
Legal and Regulatory
Ensuring compliance with applicable regulations and understanding jurisdictional requirements.
- Regulatory compliance measures
- Jurisdictional requirement understanding
- Risk disclosures and full transparency
Counterparty Risks
Risks arise from exchanges and stablecoins. Our mitigation strategies include:
- Using regulated, audited stablecoins
- Working with reputable exchanges with proof-of-reserves
- Diversification across multiple platforms
- Regular security assessments
Convexity and Leverage
Convexity refers to how futures and spot prices of an asset interact when trading derivatives or swaps. Using Bitcoin as collateral for USD-priced contracts can double the leverage impact if the market drops 50% against the trade.
At cryptobots.io, we take a cautious approach to risk management by capping leverage at 1.5x out of a possible 125x. This low leverage provides about a 40% safety net (from the break even price) before extra margin is needed to keep a position open.
Important Risk Warning
When it comes to derivative strategies, users should be aware that, due to convexity and leverage, there is a price at which the position will be liquidated unless additional margin is added to the account, also known as a margin call. This accounts for both the initial margin used and the effects of convexity.
Emotional Management
We prioritize user well-being through comprehensive emotional
management strategies and transparency
Recommendations for Managing Investment-Related Emotional Stress
Diversification
Consider diversifying your assets across different strategies, exchanges, assets, sectors, and asset classes. This strategy can mitigate risks and provide stability during market fluctuations. Our SPOT USD products can be part of this approach, which carries no liquidation risks.
Downsizing and Rebalancing
Reflect on the possibility of downsizing holdings you might consider heavily invested in. This involves reducing the size of your positions in assets that constitute a large portion of your portfolio. By doing so, you can mitigate the risk associated with over-concentration in a single asset or strategy.
 Historical Understanding
The creators of the algorithm possess years of extensive research on Bitcoin's historical data, granting them a profound understanding that enables them to establish a strategy that boasts both safety, scalability, and performance. This strategy has been tailored to accommodate its viability in the future.
 Collateral Management
Always keep enough extra funds (collateral) on the side to add margin to any position if needed. This protects you during unexpected market events (black swans) or if a position receives a margin call. Think of it as an emergency fund for your trading positions.
Our Commitment to Your Well-being
At cryptobots.io, we understand the significant impact that emotions can have on investment decisions and overall well-being, which is why our commitment to transparency and your peace of mind is at the core of what we do. We always prefer that you downsize your investment to enhance your peace of mind rather than risk a significant portion of your portfolio, especially since it's not uncommon for clients to feel fear during fast-moving market moves —including potential drawdown lengths and durations, their occurrence timelines, and associated probabilities throughout the market cycles.
Explore Our Automated Trading Ecosystem
Connect to proven automated crypto trading strategies and explore additional opportunities to maximize your earnings through our comprehensive ecosystem

Affiliate Program
Promote our most profitable crypto services and earn 25% revenue share on every successful referral while helping others access our trading strategies.
Join Affiliate Program →
Proof of Performance
Verify every trading claim with our transparent proof-of-performance system. Access blockchain-validated results and detailed trade logs.
View Proof →
Profit Share
Explore our profit share model with no upfront fees and transparent 33% performance fee structure for maximum trading potential.
Explore Profit Share →FAQ about our Automated Crypto Trading Strategies
Access our complete knowledge base with 125+ articles covering strategies, trading, account security, fees, and more.


