At cryptobots.io, we provide historical proof-of-performance (POP) in our Data Room. This guide explains how to interpret the crucial information presented, including charts, key metrics, and important disclaimers.
Interpreting Performance Charts
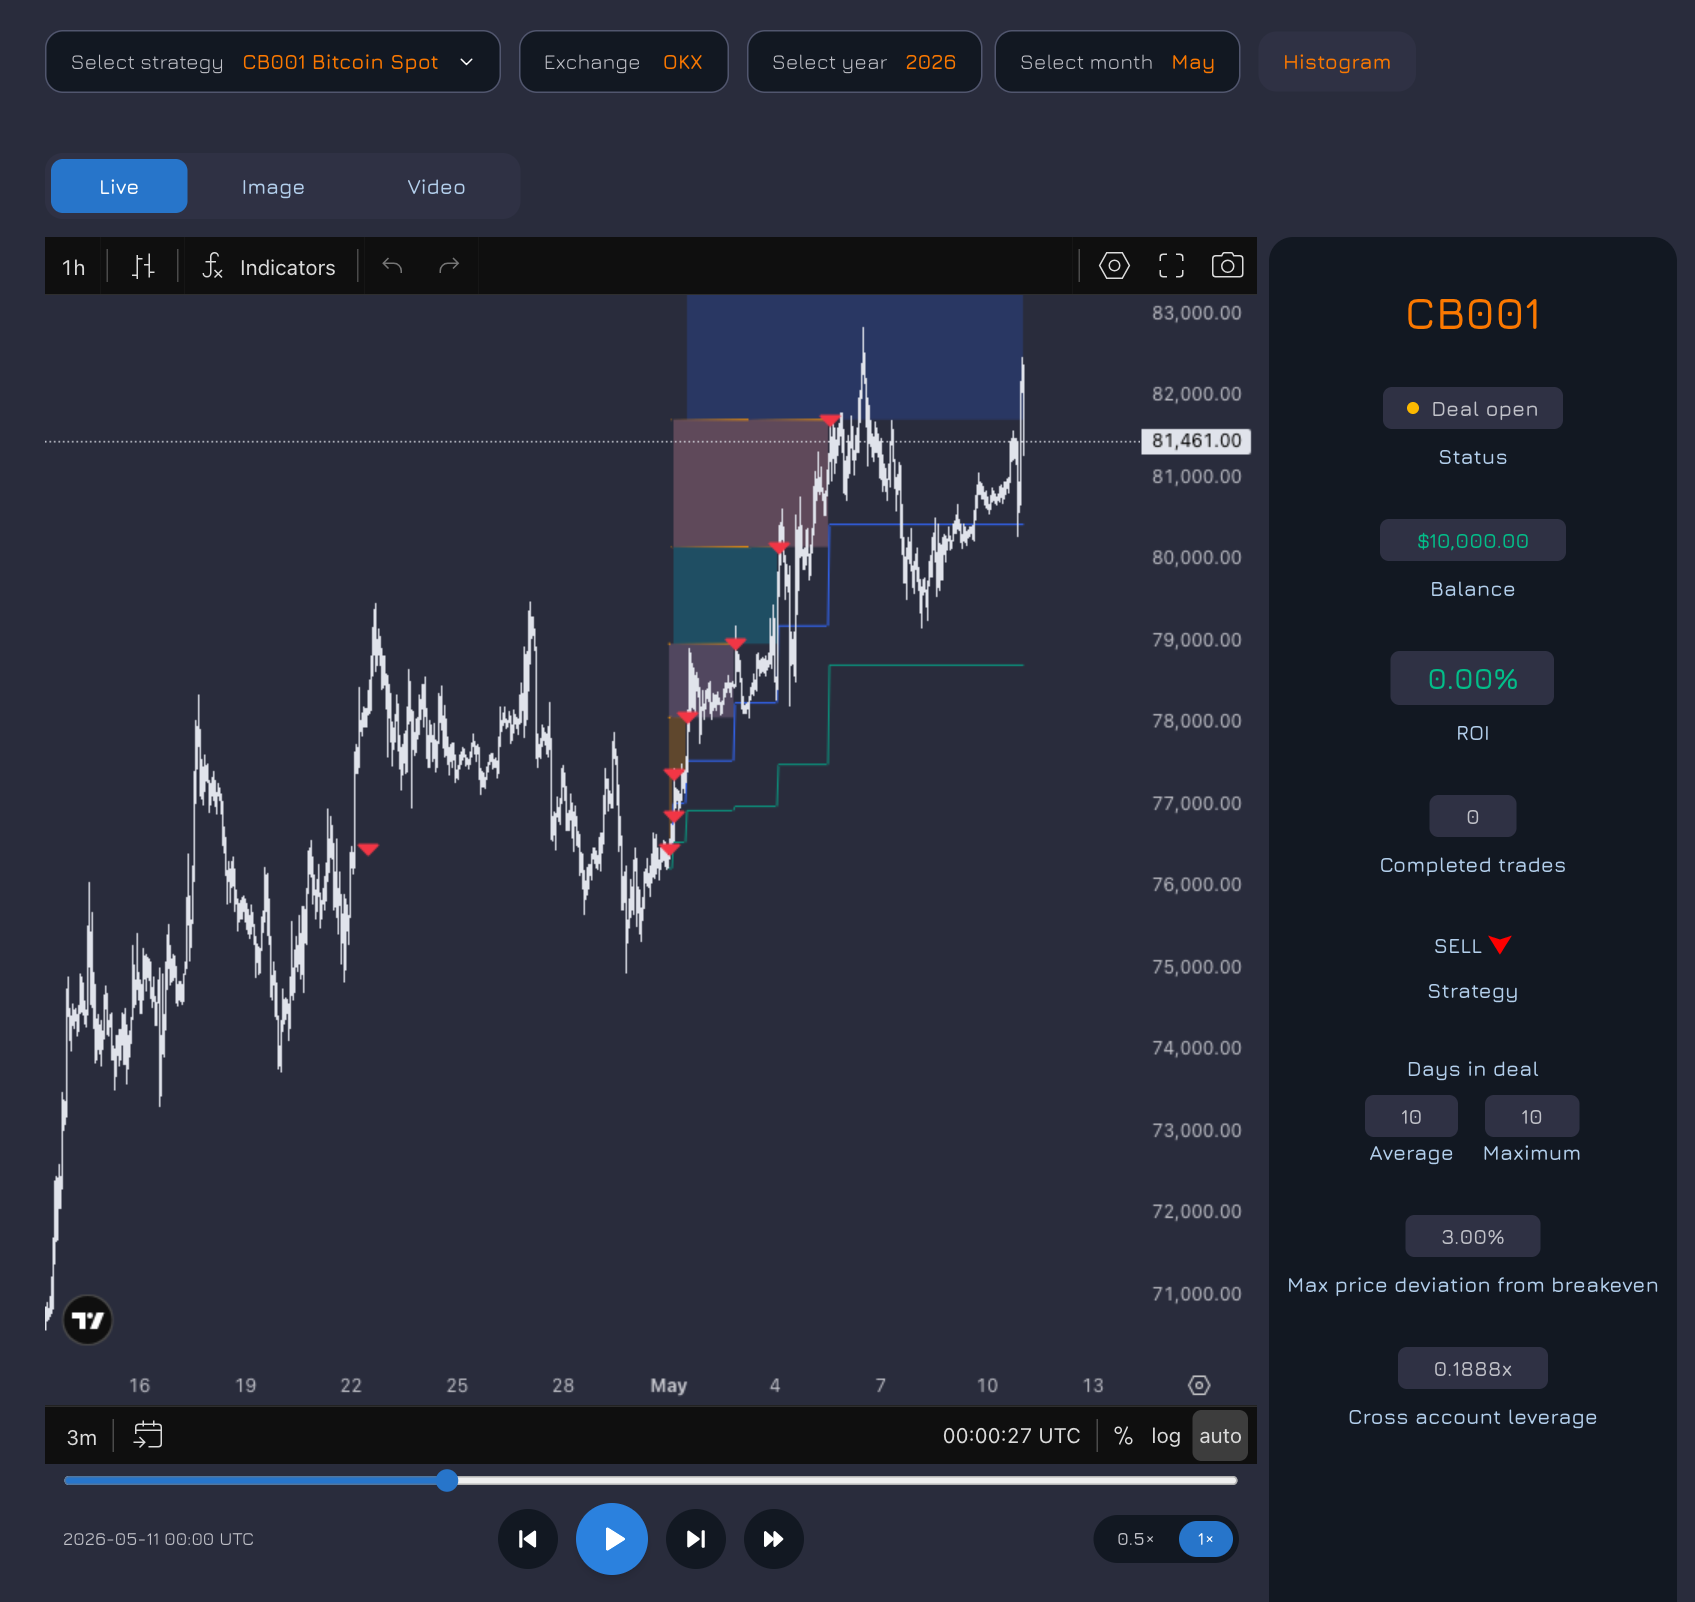
Pick a strategy, an exchange, a year and a month. The month then plays back hour by hour from real market candles, and every order, safety-order level, average price and take-profit is drawn on the chart as it happens. Four selectors set up the replay. The chart loads once both a year and a month are selected. April 2020 to present. Only months in which the strategy was ON can be selected, and each month starts at 00:00 UTC. The newest month appears once it has been authorized.
Playback Controls
Restart, Play, Pause, Next hour, End – Go back to the start, play or pause, step one 1h bar at a time, or jump to the end of the month.
Scrubber and UTC clock – Drag the scrubber to any moment of the month. The UTC clock shows exactly where you are.
Speed: 0.5x and 1x – At 1x a full month replays in about 75 seconds.
Chart Indicators
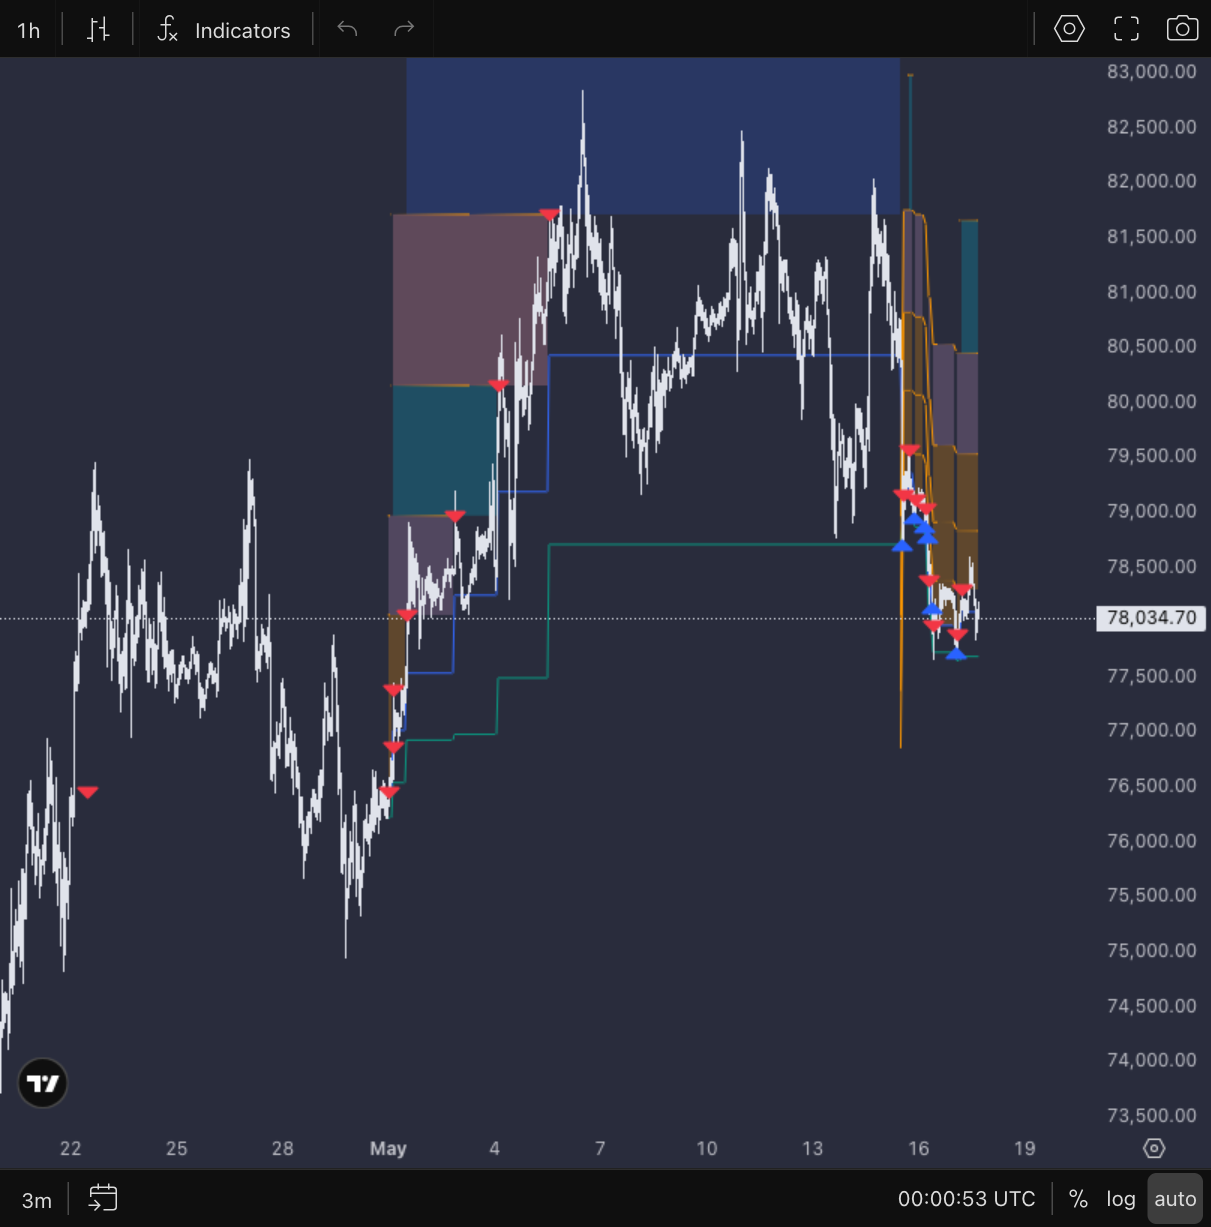
Blue Arrows = Buy – Small blue arrows mark an entry or a safety-order fill, the moment the market reached a previously placed buy order.
Red Arrows = Sell – Small red arrows mark the exit, when the market reached the take-profit level and the whole position was closed.
Orange Lines = Safety Orders – Orange lines, with a shaded band, show safety-order levels that are not yet filled. A level disappears once it is filled.
Blue Line = Average Price – The average price of the position, its breakeven. It moves each time an order fills.
Green Line = Take Profit – The target price that closes the position at a profit. It moves as orders fill.
Gray Bars = Hourly Price – Each bar is one hour of market price: open, high, low and close.
Published vs Live Statistics
The table under the chart has two columns. Published holds the official, verified monthly numbers frozen in our database, and it remains the source of truth. Live is recomputed while the replay plays, so you can watch the figures build up. Live does not replace Published.
Deals and Equity Curve
Under the chart, the deal table and the equity curve update as the replay plays. Entry, Close and PnL for each deal, filled in as deals open and close. Strategy vs Buy and hold, both as a % of capital and marked to market every hour.
Histogram
The histogram displays a graphical representation of the distribution of numerical data from month to month. This allows for quick identification of patterns and trends in the data by showing how often values occur within specific ranges.
Key Performance Metrics Explained
The Data Room highlights several key metrics to provide a comprehensive view of trading performance:
Total Profit
Shows the percentage of compounded return for the month.
Influenced by market volatility: higher volatility often leads to greater profits, and vice versa.
Average Days in Deals and Max Days in Deals
Indicates trade frequency and duration.
Affected by market volatility.
Provides insight into what to expect in terms of trade duration. For more details on trade management, see Does the System Use Your Entire Balance for Each Trade?
Max Price Deviation
Represents the maximum percentage deviation of the index being traded in that specific month, measured from the breakeven average price.
Helps assess the risk associated with the strategy. Understanding this can help answer questions like Does the bot experience losses during trading?
Strategy (Long/Short)
Indicates whether the cryptobots.io algorithm focuses on:
Buying assets expecting value increase (long)
Selling assets expecting value decrease (short)
Learn more about our system's approach in Why Cryptobots Shares Its Trading System with the Public.
Number of Completed Trades
Total count of trades opened and closed during the specified period.
Provides insight into the strategy's activity level. This metric is relevant for understanding performance in specific markets, such as with Bitcoin Bots or Ethereum Bots.
Important Disclaimers and Risk Factors
It is crucial to understand the regulatory and risk disclaimers associated with the performance data presented in the Data Room.
CFTC RULE 4.41(b)(1)/NFA RULE 2-29: Simulated or Hypothetical Performance Disclaimer
SIMULATED OR HYPOTHETICAL PERFORMANCE RESULTS HAVE CERTAIN INHERENT LIMITATIONS:
Unlike actual performance records, these results do not represent real trading.
These trades have not been executed, so results may have under- or over-compensated for the impact of certain market factors, such as lack of liquidity.
Simulated or hypothetical trading programs are designed with the benefit of hindsight.
NO REPRESENTATION IS BEING MADE THAT ANY ACCOUNT WILL OR IS LIKELY TO ACHIEVE PROFITS OR LOSSES SIMILAR TO THOSE SHOWN.
There are frequently sharp differences between hypothetical performance results and actual results subsequently achieved by any particular trading program.
Additional Risk Factors
Hypothetical trading does not involve financial risk.
No hypothetical trading record can completely account for the impact of financial risk in actual trading.
Factors such as the ability to withstand losses or adhere to a particular trading program despite losses are material points that can adversely affect actual trading results.
Numerous other factors related to the markets or the implementation of any specific trading program cannot be fully accounted for in the preparation of hypothetical performance results.
Performance Variability
Results may vary across exchanges.
While our data includes 0.1% exchange fees, it does not account for higher fees or funding fees.
Legal and Risk Disclaimer
All interested parties must check in advance whether they are legally entitled to purchase products or activate/access services presented on the cryptobots.io website/presentation.
No recommendations are made to activate this service or invest in any other investment.
cryptobots.io offers a signal trading service that is self-custodial.
Users have full access, rights, and understanding to close any position at their own discretion, risk, and responsibility.
Backtested Results Disclaimer
These are back-tested results. Actual results may differ.
The presented results assume trades start on the first of the month at midnight, which may not be your specific case.
Price data is taken from a global crypto index; individual exchanges may differ.
Additional Disclaimers
Materials on the cryptobots.io website/presentation are for illustration and discussion purposes only and do not constitute an offering.
Past performance is no guarantee of future results.
While we make our best efforts to ensure accuracy and correctness of information, we do not accept any liability or responsibility for errors or omissions.
Access to products and services may be restricted for certain people or countries.
It is your responsibility to ensure compliance with the laws and regulations of your domicile.
Get Started with Cryptobots
If you are ready to register and explore the opportunities with cryptobots.io, follow this link: Get Started.